Streisand (and scientists worldwide) mean that climate is getting more extreme (and extreme climate is getting more extreme) and more frequent.OK - paragraph by paragraph...
We have never had, in human recorded history, this many tropical storms in one season, this many tropical storms turn into hurricanes in one season, and this many category 3+ hurricanes in one season. We ran out of names and moved to the Greek naming system.
With your attitude and with your level of knowledge, let's hope that you live in a coastal region.
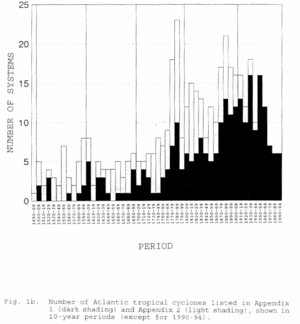
"Streisand (and scientists worldwide) mean that climate is getting more extreme (and extreme climate is getting more extreme) and more frequent."Streisand (and scientists worldwide) -- 'scuse me but Barbra Streisand is a popular entertainer, not a scientist. Perhaps you meant to say "S. as well as scientists". Minor nit aside, some agenda-driven scientists are saying that the climate is getting more extreme but if you scratch the surface and do a little research, you will find that these "scientists" are being very careful as to what data they look at and which computer models they employ for their projections. Storm data for the North Atlantic is available from 1492 to present. Sea Captains have always kept logbooks recording the minutiae of sea-going life as well as major events. Here is a graph of Atlantic Tropical Cyclones dating from 1490 through 1994 from the National Hurricane Center:

Click for full-size Image
"We have never had, in human recorded history, this many tropical storms in one season, this many tropical storms turn into hurricanes in one season, and this many category 3+ hurricanes in one season. We ran out of names and moved to the Greek naming system."You know what? You are right. The 2005 season was a doozy and it shattered the records. But, let us look at the big picture: From the National Climatic Data Center analysis of the 2005 season:
Season SummaryBut -- to continue:
There were a record 27 named storms, of which 14 were hurricanes, exceeding the 1969 record of 12 hurricanes, and 7 were major hurricanes. Of the 7 major hurricanes, an unprecendented 3 reached category 5 status, with a 4th reaching the greatest possible windspeed within category 4 of the Saffir-Simpson scale. The season has been remarkable for its early beginning and number of storms as well as the intensity of the hurricanes, including the most intense hurricane on record for the Atlantic. Many records were broken during the season and a list of the most notable are available at the end of this summary.
Since reliable records began around the middle of the 20th century (1944) with routine reconnaisance aircraft missions, no season has exceeded 19 named storms until 2005. However, it is known that at least one other season exceeded 20 named storms before 1944 and that was 1933 (21). Prior to the launch of satellites in the 1970s, and particularly before the routine reconnaissance aircraft missions, it was difficult to detect storms that did not affect land or ships, and it is therefore likely that activity in some seasons before the middle of the 20th century is underestimated.And one more paragraph:
Instead of examining only the number of tropical storms and hurricanes as an indicator of activity, NOAA's Accumulated Cyclone Energy Index takes into account the cumulative strength and duration of each storm. As shown in the figure to the right, 2005 is the third most active season on record behind 1950 and 1995 in terms of the ACE index. Tropical cyclone activity in the Atlantic basin has been above normal since 1995. This has been largely in response to the active phase of the multi-decadal signal. The average number of named storms since 1995 has been 13, compared to 8.6 during the preceding 25 years during which time the multi-decadal signal was in an inactive phase. An average of 7.7 hurricanes and 3.6 major hurricanes since 1995 compares to 5 hurricanes and 1.5 major hurricanes from 1970-1994.Follow the links and read the rest of this analysis. The overall storm energy was about the same but the number of major storms was greater. If what we were seeing was a result of Global Warming, the overall storm energy would be greater. And to make sure that we are on the same page, I firmly believe that we are entering a Global Warming period. If you look at the historical record, we have had them every couple hundred years or so. In the 900's, settlers in Greenland were harvesting wine grapes. Wine grapes require a lot more heat than eating grapes (the heat promotes the production of the sugar needed for fermentation). In the 1500's Europe was frozen in the Little Ice Age. Brueghel painted this image of the canals frozen over:

"With your attitude and with your level of knowledge, let's hope that you live in a coastal region."Mike -- you possess not only a small mind but also a small heart. I would never wish this on anyone in the spirit that you are wishing it to me. My wish for you is that you experience some growth: personal, emotional and scientific. As for me, I like where we live -- in the foothills of an active volcano.
