A chilling graph from farmer Nelson Reus:
Going through some old stuff in my office. Came across this slide show by Dan De Boer (marketing) in January 2012. He died during the “grain rally” that summer. Lots of prophetic tidbits from 2012 drought to the cold/wet #noplant19 God help us if these things keep coming true. pic.twitter.com/QaaXOk6IZv
— Reus Ag (@NelsonReus2) May 26, 2019
Here is the graph cropped and rotated:
As a reminder - from Infogalactic:
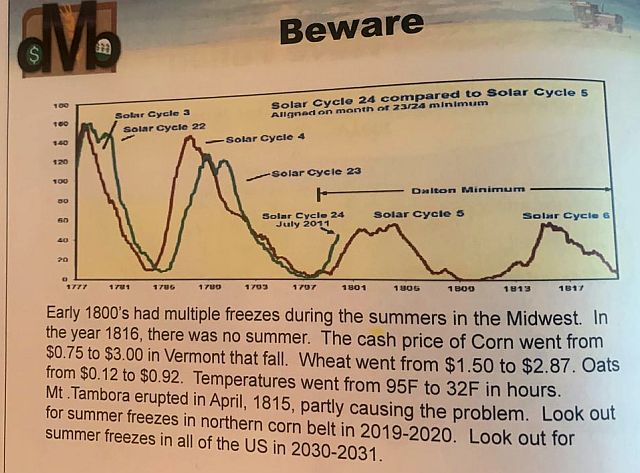
Dalton Minimum
The Dalton Minimum was a period of low sunspot count, representing low solar activity, named after the English meteorologist John Dalton, lasting from about 1790 to 1830 or 1796 to 1820, corresponding to the period solar cycle 4 to solar cycle 7.
Like the Maunder Minimum and Spörer Minimum, the Dalton Minimum coincided with a period of lower-than-average global temperatures.
To re-cap, a period of about 30 to 40 years of significantly coler weather caused by low solar output. Our sun is a naturally variable star. It is the primary driver of our climate - not fossil fuel use.

Leave a comment