Some numbers from this article at Vox by way of Bellingham geologist Dan McShane:
How we know ending social distancing will lead to more deaths, in one chart
People will die if we end social distancing early. This chart proves it.
President Donald Trump already wants to pull back social distancing policies and guidances implemented in response to the coronavirus pandemic. But we know, based on the nation’s history with past outbreaks, what will happen if we do this too early: People will die.
In 1918, the world was ravaged by a horrible flu pandemic, which was linked to as many as 100 million deaths globally and about 675,000 deaths in the US. In response, cities across America adopted a variety of social distancing measures to combat the pandemic. Based on several studies of the period, these measures worked to reduce the death toll overall.
But many cities, also worried about the effects of social distancing on normal life and the economy, pulled back their social distancing efforts prematurely. When they did, they saw flu cases — and deaths — rise again.
Consider St. Louis. The city is now heralded as an example of how to do social distancing right because it took an aggressive and layered response to the flu pandemic early on. But as a 2007 study published in JAMA found, St. Louis in 1918 pulled back its social distancing efforts prematurely — and that led to a spike in deaths.
Here’s how that looks in chart form, with the line chart representing excess flu deaths and the black and gray bars below showing when social distancing measures were in place. The highest peak comes after social distancing measures were lifted, with the death rate falling only after they were reinstituted.
The usual obligatory Trump bashing in the first paragraph - President Trump wants to restore businesses sometime around Easter, he has said nothing about stopping the basic prophylactic measures - hand washing, social distancing, etc... Here is the chart:
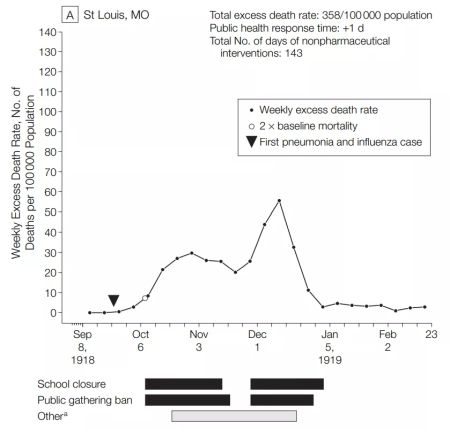
Right there in black and white - you are looking at the black bars at the bottom for School closure and Public gathering ban. They relaxed these measures mid-November and saw a large uptick in deaths. The paper also:
Analyzing data from 43 cities, the JAMA study found this pattern repeatedly across the country. Howard Markel, an author of the study and the director of the University of Michigan’s Center for the History of Medicine, described the results as a bunch of “double-humped epi curves” — officials instituted social distancing measures, saw flu cases fall, then pulled back the measures and saw flu cases rise again.
Notably, the second rise in deaths only appeared when cities removed social distancing measures, the JAMA study found: “Among the 43 cities, we found no example of a city that had a second peak of influenza while the first set of nonpharmaceutical interventions were still in effect.”
Common sense - you can't catch it if it can't reach you. Good basic science.

Leave a comment